Tables
All tables share a common format for displaying information, and provide similar navigation controls. To display the Custom Table page, use the left-nav menu, and select Custom Table. To display a Spotlight overview table, use the “left-nav” menu, expand the applicable Spotlight sub-menu (for example, App Spotlight or Platform Spotlight), and click the overview you want.
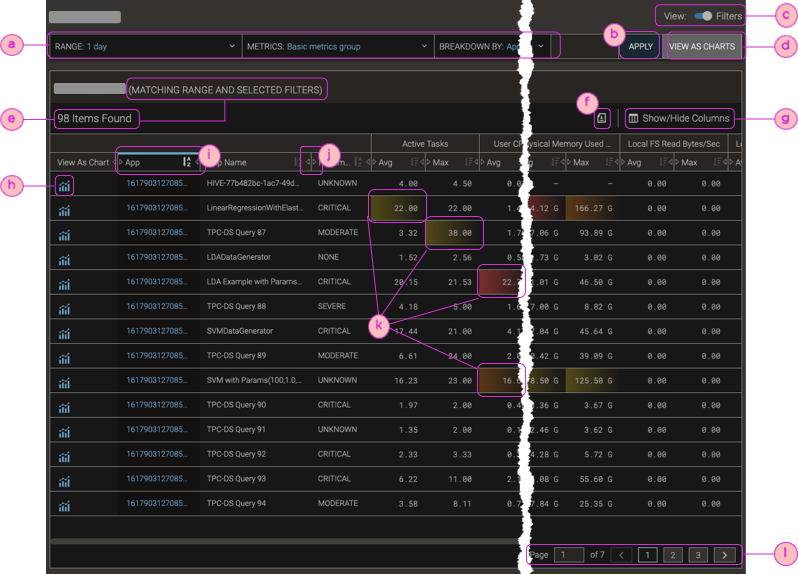
| ⓐ | Filter Bars; for details, see Filter Bars |
| ⓑ | Apply changes made in filters |
| ⓒ | Toggle for hiding/showing the filter bars |
| ⓓ | Change the tabular display to a charts display, with the same data and applied filter settings |
| ⓔ | Number of items found that match the applied filter settings |
| ⓕ | : Export (download) the table as a CSV file |
| ⓖ | : Show/Hide Columns (and rearrange table columns) |
| ⓗ | : View as Chart—Show the given row's breakdown data as a chart, with the same applied time range and metrics filter settings as the table |
| ⓘ | Sorted column (indicated by a blue highlight) that’s below the column heading when the values are sorted large-to-small, and above the heading when the values are sorted small-to-large |
| ⓙ | Adjust the column width |
| ⓚ | Color highlighting for outlier values (calculated as standard deviations from the column’s average value) |
| ⓛ | Pagination controls |