Visualizations (Charts and Tables)
The Pepperdata data visualizations—graphic representations of your clusters’ data that make it easy to spot patterns, trends, and system anomalies—provide a picture of your entire cluster. You can filter and control a variety of display attributes of the visualizations, as well as export the graphical representations and underlying numerical data in a variety of formats.
The visualizations are presented as charts, reports, and tables.
-
Charts show time series information: how a particular metric, for example, an application’s CPU usage, varies over a selected time period. Charts are useful for seeing status for a specific time or the general trend for a given metric.
-
Tables show aggregated information of the time series information (charts), and enable grouping the information by users and queues (for YARN clusters) or Pods and namespaces (for Kubernetes clusters), and so on. For example, you could show the peak number of concurrent tasks or the average CPU usage.
For visualization-specific details, see the following topics:
- Charts
- Tables
- Compute Customized Metrics
- Custom Dashboards: Charts You Want to See (YARN)
- My Dashboard: Cluster View/Home for Your Users and Queues (YARN)
Dashboard Time for Display and Input
By default, the Pepperdata global dashboard time zone matches your browser’s (system’s) local time. If you change the time by using your machine’s system controls, and the dashboard global time remains at Use local time zone, the dashboard time zone changes to match your new machine, system time. However, you can change the dashboard time zone for all the dashboard pages by setting your time zone preference.
Procedure
-
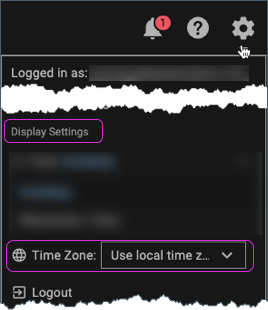
In the dashboard’s “top-nav” navigation, click the Setting icon (Settings (), and make your selection from the Time Zone list.
Dates are always displayed in yyyy/mm/dd format; for example, January 2, 2017 is displayed as “2017/01/02”. Times are always displayed as HH:MM, in 24-hour format; for example, 10:22 is in the morning (AM), and 22:22 is in the evening (PM).
You can also change the dates, times, and time zone on temporary, page-level basis for charts, tables, and the Chargeback, Application Profiler, and Query Profiler reports by using the Time Range Filter in the filter bar (below the page’s title); see Page-Level Time Range Filter.
Exporting Charts and Tables
You can save and download charts and tables in a variety of formats, which you can use as input for external processing and analysis or to send as feedback to users about their jobs and effect on the cluster.
When you export a chart or table, the times match the time zone setting currently in effect for the page: the Time Range filter setting, if it’s been set; otherwise the global dashboard time.
Procedure
-
Display the desired chart or table by using the dashboard’s Charts or Tables options.
-
Select and apply the desired filters.
-
Click the Download icon ()—generally located in the top-right corner of the chart or table—and choose the export format.