Common Controls and the Dashboard Cluster View
The Pepperdata Dashboard (the Home page) provides navigation controls and shows the cluster view—sections of tiles that highlight important aspects of your cluster, such as resource usage by applications and (for YARN) queues, and metrics related to your environment (YARN or Kubernetes).
On This Page
Common Controls
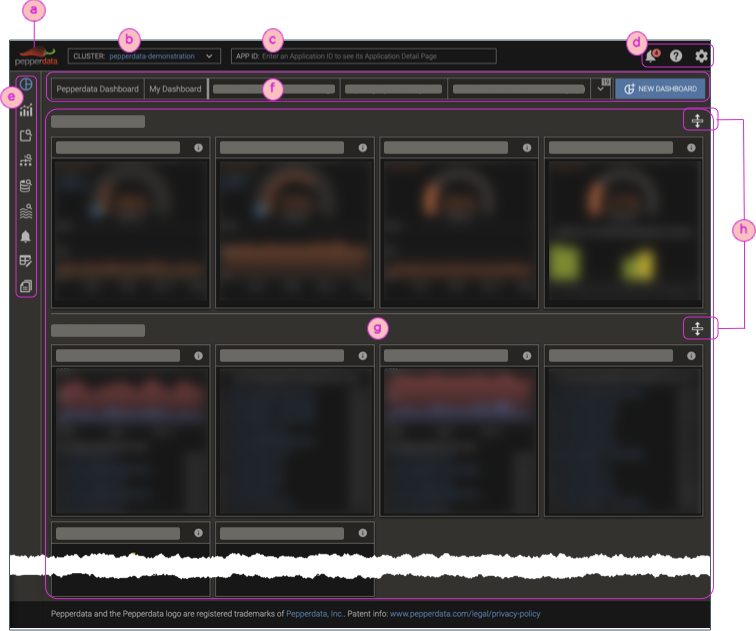
| ⓐ | Home link (to Pepperdata dashboard) |
| ⓑ | Realm/cluster list |
| ⓒ | Entry to Application Detail Page |
| ⓓ | "Top-nav" navigation to:
|
| ⓔ | "Left-nav" navigation to Dashboards, Charts, Spotlight overviews for your Pepperdata products, Alarms, Custom Table, and Reports; for details, see "Left-Nav" and the Dashboards Menu |
| ⓕ | "Dashboard bar" navigation to the Pepperdata Dashboard, My Dashboard (YARN-only), and custom dashboards |
| ⓖ | Cluster View contains sections for those cluster highlights that are available for your environment (YARN or Kubernetes) and Spotlight products, such as Hardware Resources, YARN and HDFS Resources, Namespaces, Application, YARN Queues, Recommendations, Cluster Health, Kafka, and GPU Power and Temperature |
| ⓗ | Rearrange sections control; drag-and-drop the sections in any order that you want |
Cluster View
The Cluster View section of the dashboard Home page shows just those sections that are relevant to (and available for) your environment. Therefore, you might see elements in this documentation, particularly in screenshots, that do not appear in your dashboard.
If you have any questions, contact Pepperdata Support.