Filter the Charts & Tables by Dimensions: Hosts, Users, Etc.
By default, charts show breakdowns for dimensions with the max/min values (according to metric), which highlights the primary contributors. However, it’s often helpful to drill down to specific series of interest. For example, after viewing all hosts’ contributions to resource usage of some kind, you might want to focus on particular hosts. You can filter the breakdowns by showing series that match specific names/IDs, that match a regular expression (a regex), or that match an advanced breakdown filter query for status data or a specific metric-value combination.
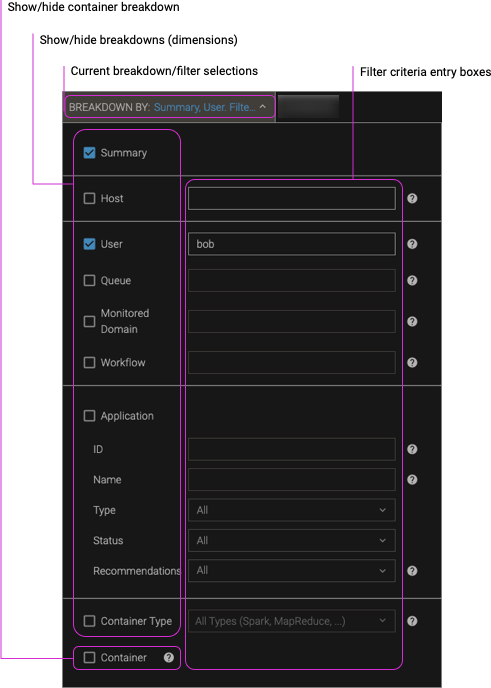
The filter criteria entry boxes are next to the breakdown selections for charts.
When you select metrics for charts, the available series options change to show only the relevant series. For example, the Memory information group is applicable only for Summary, Host, and Device series, but the Basic metrics group for jobs is applicable for the Summary, Host, User, Queue, Job Group, Workflow, App, and Container Type series.
On This Page
Procedure
-
Show the default (unfiltered) charts for the breakdowns and metrics that you’re interested in.
-
In the filter bar, click Breakdown By.
-
(Optional) Select one or more dimensions to show charts for.
-
If you do not select any dimensions, only the Summary charts will appear, and no breakdown filters will be enabled.
-
Selecting a dimension enables the preceding dimensions’ filters for entering match criteria.
-
The selections are cumulative. For example, if you select Application, Workflow, and Queue, charts are shown for queue, workflow by queue, and application by workflow by queue.
Depending on the combination of breakdowns that you choose and how they are preaggregated by the Pepperdata dashboard, the resulting chart rendering can be rather slow. To speed up the chart display, change the selected breakdowns.
-
-
In the filter box for each dimension that you want to filter, enter the filter criteria—names/IDs, regex, or advanced breakdown filter query.
Not all filtering mechanisms are applicable to all dimensions, and not all options are enabled by default. For details, see Filtering Mechanisms and Regular Expressions (Regex).
-
Names/IDs—Enter an exact series name (such as a host name or user name) or comma-separated list of series names.
Alternatively, you can display the chart for all series, show its Legend, and in the legend, click the name of the series you want.
To exclude a single series, enter its filter criteria as above, but prefix it with the exclude operator,
!(the exclamation point).To include a single series that is filtered out by default—which happens when there are more series than the current maximum number to show, and the series you want has values outside the “top n” that are shown based on their MAX/MIN values—enter its filter criteria as above, but prefix it with the include operator,
+(the plus sign). -
Regex—Enter a regular expression that typically matches multiple series. For formatting requirements, see Filtering Mechanisms and Regular Expressions (Regex).
-
Advanced Filters—Enter an advanced breakdown filter query to evaluate and find series for which the query expression is true. For details about the keywords, applicability to breakdowns, and syntax, see Reference: Advanced Breakdown Filters.
-
-
Click Apply.
The charts refresh to show charts for the dimensions you selected, filtered by the series dimensions that you entered. The filter queries appear in their corresponding breakdown Filter by box and above each column that contains filtered series.
-
(Optional) To show container breakdowns, which require that the charts already be filtered by Host and/or App, select the Container checkbox, choose which container types you want from the Container Type list, and click Go.
The charts refresh to show additional charts for container breakdowns.
Filtering Mechanisms and Regular Expressions (Regex)
There are three methods for filtering breakdowns.
-
For specific names/IDs, such as a host name or app ID, specify the exact name and, optionally, an include or exclude operator as described in the procedure.
-
To find names that match a pattern, such as “hosts that begin with ‘demo-host-‘”, use a regular expression.
-
Wrap the regular expression in leading and trailing
/characters.For example, to search for
.*\.pepperdata\.com, enter the regular expression as/.*\.pepperdata\.com/. -
In general—except for the leading and trailing
/characters—regular expression syntax is according to the Java class documentation for regex .
-
-
To find breakdowns for application (job) names, series with metrics of given values, or series with certain Pepperdata features enabled, use Advanced Breakdown Filters.
Notes
-
Container breakdowns are not enabled by default because they take a long time to render, especially for the large number of hosts and/or apps that are charted unless you filter the breakdowns for only a few hosts and/or apps. To enable container breakdowns, filter for the hosts and/or apps that you want.
-
To filter the Container Type breakdown, click the drop down list and select the checkboxes next to the container types that you want.
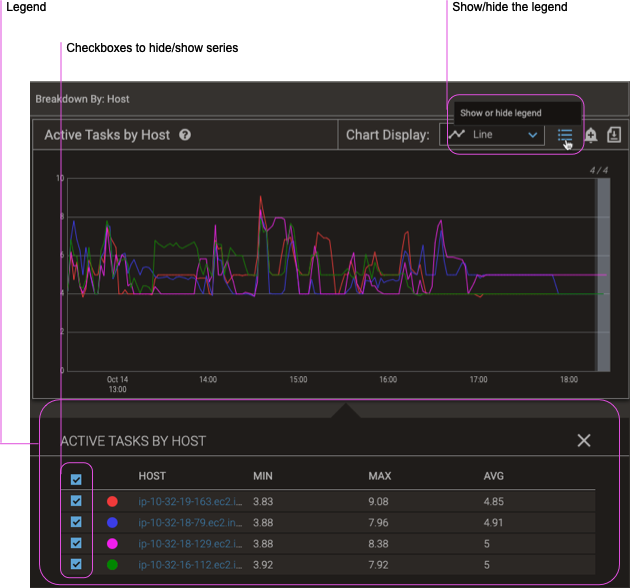
Hide and Show Series in a Chart with the Legend Filter
Charts typically show so many series for each breakdown (the Show chart for selections, such as hosts, users, and queues) that it can be hard to determine which color graph corresponds to each series. To narrow the number of series on the display, use the legend filter to toggle whether a matched series, such as a given user, queue, or application, is shown on the chart.
Procedure
-
Display a chart.
-
Click the show/hide legend icon (list).
-
In the resulting list, clear and select the member checkboxes to turn a series display off and on, respectively.