Spark Stage Details Report
The Spark Stage Details Report uncovers root causes of an Apache® Spark app’s failures or performance problems, such as memory pressure or data skew. The report shows executors, task, TSD metrics, and error information for one stage attempt of an Apache® Spark application. Proportional bar charts show the number of tasks for each executor and the executor’s duration. You can visually correlate the data for a given executor across the set of metrics charts.
On This Page
View the Spark Stage Details Report
The context for the Spark Stage Details Report is an application’s Stage Summaries and Events information in the Spark Details Report. When an app fails or performs poorly, this stage data points to one or more stages of concern, which are the ones you’ll want to examine further by viewing the associated Spark Stage Details Report.
Procedure
-
Create the Spark Details Report for the application of interest. (See Create an App’s Spark Details Report.)
-
Use either of the following methods:
-
In the stage summary, click the block of the stage of interest.
(If you do not know which block corresponds to the stage you want, mouse over the stage’s row in the tabular stage data. The corresponding stage block highlights.)
-
In the tabular stage data, click a stage’s link (in the Stage:Attempt or File Name column—they reference the same stage).
The Stage Details Report appears.
-
Elements of the Spark Stage Details Report
The figure shows a typical Spark Stage Details Report.
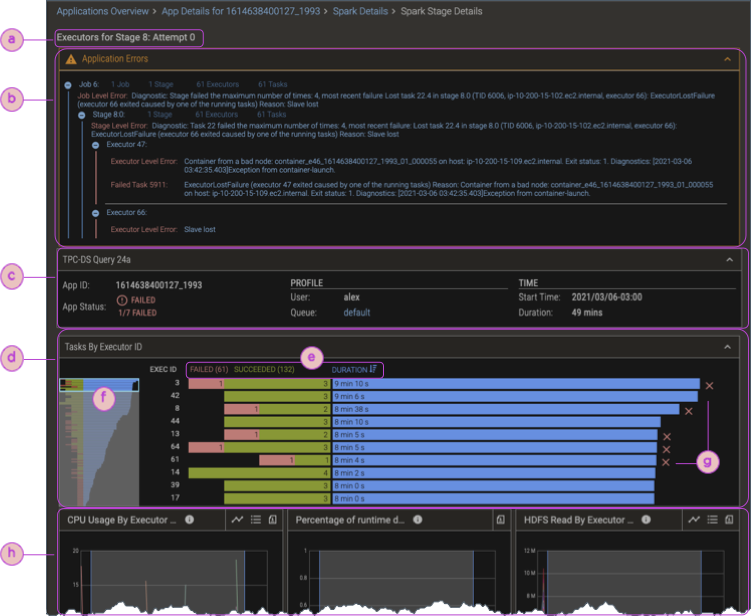
| ⓐ | Stage identifying info |
| ⓑ | Error banner (not shown if there were no errors during the stage attempt) |
| ⓒ | The app info provides an summary of the application—its name, Id, type of app, and so on. |
| ⓓ | Executors details:
ⓔ Sort the executors by the number of failed tasks, succeeded tasks, or executors' duration. ⓕ If there are more than 10 executors for the stage, a view window is shown. Drag it to show any 10 adjacent (per the current sorting) executors. ⓖ Mouse over to show diagnostics related to failed tasks. |
| ⓗ | TSD metrics charts; mouse over an executor to highlight the corresponding executor duration in the executors details (ⓓ). |
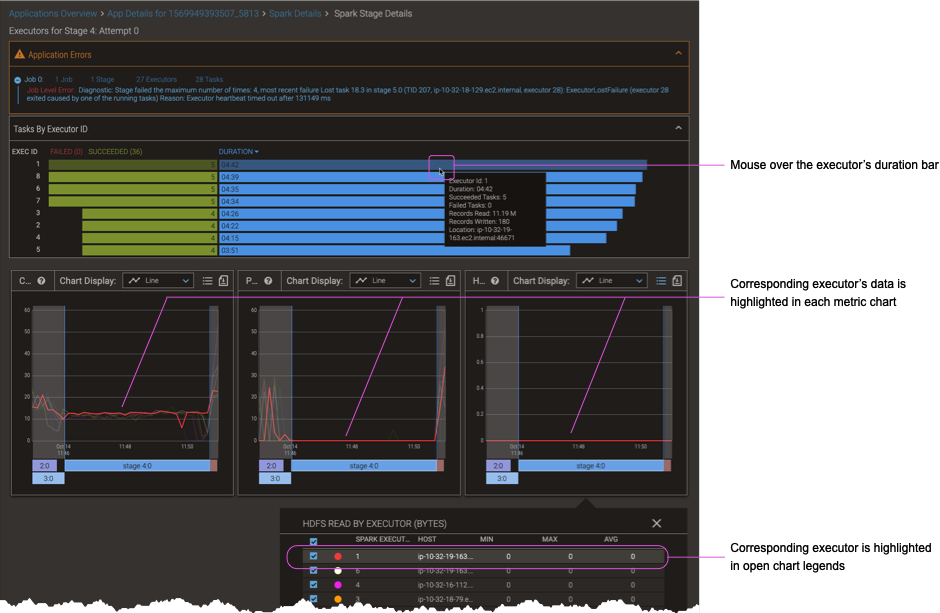
Correlate the Executors and TSD Metrics Charts
The Spark Stage Details Report interface makes it easy to correlate the data across sections of the report. When you mouse over or click almost anything in the executor details and TSD metrics charts, the display highlights corresponding executor or time information in the other report elements.
-
To highlight a given executor’s data in all the metrics charts, mouse over the executor’s task or duration bar in the executors details section.
-
To highlight the executor’s data in the executors details section that corresponds to a given metric chart’s executor data, mouse over the executor’s data in the metric chart.