App Details: Header
The Header at the top of the App Details page provides an overview of the application.
This example shows a Spark app that ran in a YARN cluster.
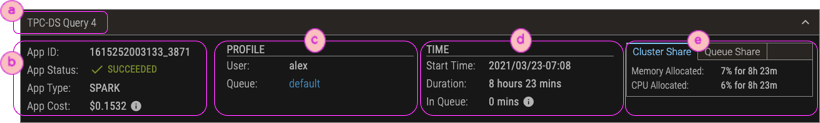
| ⓐ | Application name. If the name is too long to be displayed, mouse over it to see the full name. |
| ⓑ | The App Info section shows the App's Id, its status, and its type. For YARN clusters, the App Cost shows the total monetary cost for memory and CPU. To see resource-based costs (Memory GB-hours and CPU core-hours) and a link to the associated Chargeback Report page, mouse over the associated information icon (info). For Kubernetes clusters, this section includes the namespace in which the app ran. Click its link to show the Namespace Overview filtered by the given namespace. |
| ⓒ | (YARN-only) The Profile section shows the user who ran the app, and the queue in which the app ran. |
| ⓓ | The Time section shows the start time, duration of the app's execution, and for YARN clusters, the time spent in the queue (which is included in the overall duration time). |
| ⓔ | The Resource Share tabs show the percentage of applicable resources memory and CPU that were allocated to the app during its run. The allocated percentage might ve more than the app actually used, but nonetheless, the resources were unavailable for the cluster's other apps to use. Cluster Share is shown for YARN and Kubernetes clusters. Queue Share is shown only for YARN clusters. |