App Details Page
The App Details page provides an at-a-glance view of any issues that an app experienced during its run, as well as status information that likely contributed to the app’s success or problems.
For detailed steps for showing the App Details page for a given application, see Finding Your Applications.
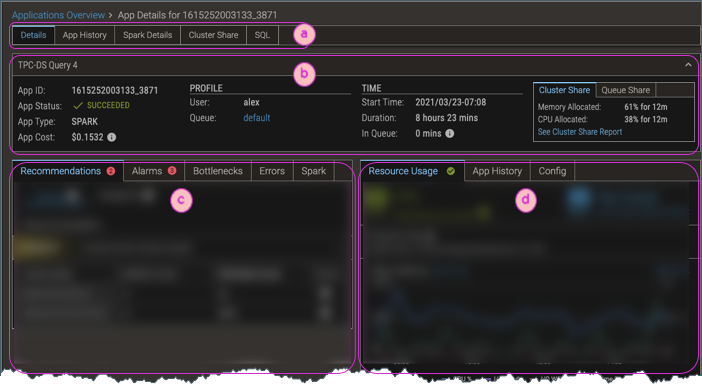
| ⓐ | Top-level tabs provide access to sub-pages of application details.
|
| ⓑ | The header provides an overview of the application—its name, Id, type of app, and so on. The Cluster Share data shows how much of the cluster's resources the application allocated (which might be more than it actually "used", but it was unavailable for any other application). Click the See Cluster Share Report link to show how this application's usage compares with the rest of the load on the cluster. |
| ⓒ | The tabs of the Issues section show recommendations, alarms, and information that is specific to the type of app (such as MapReduce or Spark) and environment (YARN or Kubernetes). For details, see Issues Tabs. |
| ⓓ | The Stats section shows resource usage charts for the most relevant metrics (based on whether it's a YARN or Kubernetes cluster), culled from the hundreds of metrics that Pepperdata collects; app history; and configuration settings. For details, see Stats Tabs. |