App Details: Stats
The Stats tabs show the underlying data for the recommendations and alarms in the Issues tabs.
This example shows a Spark app that ran in a YARN cluster.
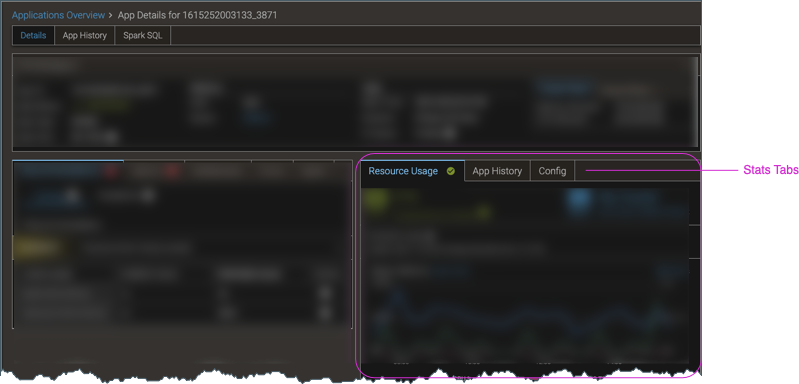
The Stats section includes the following tabs:
-
Resource Usage—An at-a-glance view of the resources used by the app.
-
(YARN-only) Before the charts, container size data for the app is provided.
-
Next are charts that highlight the most important metrics based on the cluster’s type.
- For YARN clusters, there are charts for basic metrics, I/O, and the usage for different types of memory.
- For Kubernetes clusters, there are charts for CPU, I/O, different types of memory, garbage collection, Pod phase status, and when applicable, GPU usage.
For details about a chart’s metrics, click Learn more next to the chart’s title. To display a chart as a full-width page, filtered for the appropriate breakdown, click the associated Charts icon ().
-
-
App History—Key metrics such as runtime duration, peak memory usage, and allocation charges, for the app’s current run and four previous runs. Runs for which there are no recorded finish times are omitted from the display, but you can see details of those runs by showing their App Detail pages.
-
SQL Query—(YARN-only, Hive on MapReduce apps with a single SQL query, with Application Profiler enabled) The SQL query code. If there were issues with the app, it’s helpful to see the query that the app ran. If the SQL query exceeds 8,000 characters, the display truncates the query and shows ellipsis (…).
-
Config—For Spark and MapReduce apps, the actual configuration settings that were in effect for the app’s run. If there were performance or resource issues with the app, it’s helpful to see the configuration for its run, and then make changes for subsequent runs.