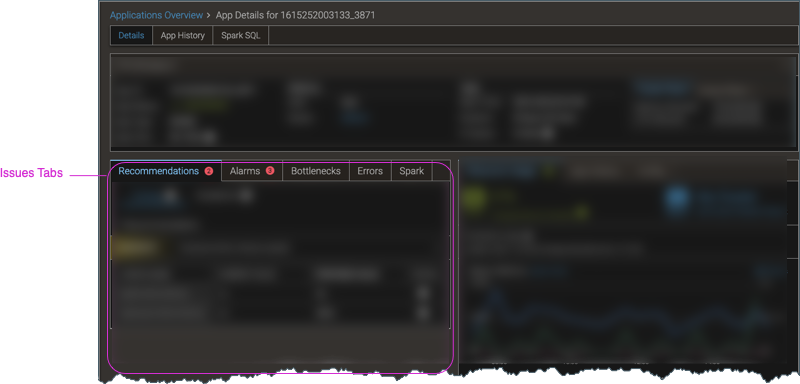
App Details: Issues Tabs
The Issues tabs collect everything of concern about your app into one place. To best optimize your app, you should navigate through the tabs from left to right to: perform the recommended actions; tend to alarms; (for YARN clusters) arrange to run your app when there are a minimum of bottlenecks in the system; and correct errors that are specific to the type of app (such as Spark, MapReduce, or Tez).
On This Page
This example shows a Spark app that ran in a YARN cluster.
Recommendations Tab
The Recommendations tab shows actionable tuning and guidance recommendations for improving application performance. If there are any recommendations for the app, the number of recommendations appears in a red badge next to the Recommendations name in the tab.
Although which Pepperdata component performs the profiling depends on the Pepperdata product and type of application—in Application Spotlight, it’s the Application Profiler; in Query Spotlight, it’s the Query Profiler; and so on—the process is similar:
-
Pepperdata collects metrics data.
-
Pepperdata aggregates the data into a simplified performance profile.
-
Pepperdata evaluates the performance profile against a set of heuristics, and as a result recommends configuration changes and tuning activities to improve performance.
There are two types of recommendations:
-
Tuning. Provides concrete, prescriptive actions, such as changing a configuration key to a specific value.
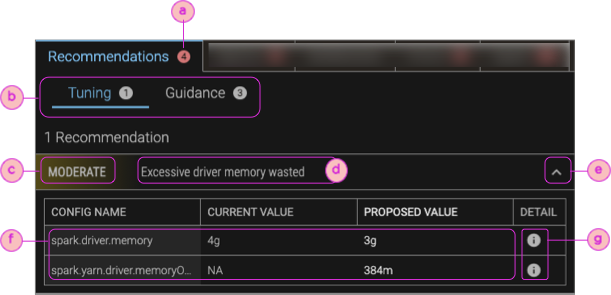 Although the vast majority of tuning recommendations are presented as shown, there are a few tuning recommendations that are not associated with a particular configuration key’s value, and therefore are provided in the same format as the guidance recommendations.
 -
Guidance. Provides general troubleshooting suggestions.
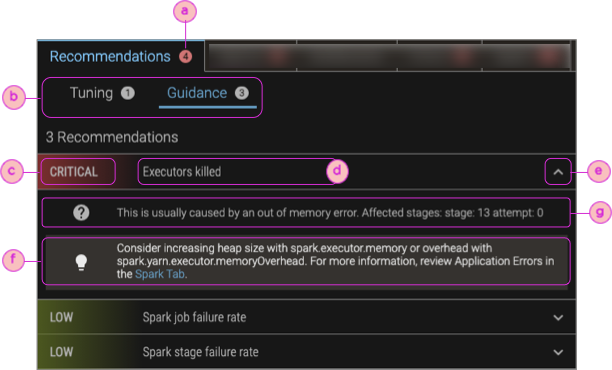
Although the presentation is slightly different, the same type of information is provided for tuning and guidance recommendations. See the table of callouts for details.
| ⓐ | Number of recommendations for the app. |
| ⓑ | Number of tuning and number of guidance recommendations (in white badges). The blue underline indicates which set of recommendations you're looking at (tuning or guidance). |
| ⓒ | Severity of the recommendation. |
| ⓓ | Name of the recommendation. |
| ⓔ | Collapse/expand control to hide/show the details of the recommendation. |
| ⓕ | Actionable recommendation for improving the app's performance.
|
| ⓖ | The cause (trigger) of the recommendation.
|
Alarms Tab
The Alarms tab shows all the alarms that are configured for the app:
-
Firing alarms have a red icon (notifications_active). If there are any currently-firing alarms, the number of firing alarms appears in a red badge next to the Alarms name in the tab.
-
Alarms that are on but that are not firing have a green icon (notifications).
-
Alarms that are configured but that are turned off have a gray icon (notifications_off).
On the Alarms tab, you can perform basic alarm management for application-specific conditions: create new alarms, edit alarms, and delete alarms. (You cannot edit alarms that were created outside this Alarms tab.) For details, see Create Alarms from the App Details Page.
To toggle an alarm’s status from on to off, or vice versa, use the Alarms & Alerts page, which is accessible from either the “left-nav” or “top-nav” menus. For details, see Disable and Enable Alarms.
(YARN-only) Bottlenecks Tab
The Bottlenecks tab provides an at-a-glance view of cluster-wide conditions during the app’s run that could have been the source of bottlenecks. If there were bottleneck conditions during the app’s run, the number of bottlenecks appears in a red badge next to the Bottlenecks tab name, and the conditions are shown in red instead of green.
The following conditions appear in the Bottlenecks tab:
- Time Spent in Straggler Task State (only for MapReduce apps)
- Time Spent Waiting in Queue
- CPU Bound
Related Procedures
-
To receive notifications of bottlenecks in future app runs, click the Create Alarm icon (add_alert) for bottlenecks of interest. Not all bottlenecks have this functionality.
-
To create an associated alarm, click the Create Alarm icon (add_alert), enter the information, and click the Save icon (save). Not all bottlenecks have this functionality.
-
To view, edit, delete, or disable an alarm, click the View Alarm icon (), which takes you to the Alarms tab, where you can edit, delete, or disable the alarm.
(YARN-only) Errors Tab
The Errors tab lists the errors reported by YARN containers, as seen by NodeManagers. If there were any errors duting the app’s run, the number of errors appears in a red badge next to the Errors name in the tab.
(Spark Apps) Spark Tab
For Spark applications, the tab shows the Application Errors Report from Pepperdata Code Analyzer for Apache Spark, a link to the corresponding Spark App Details Report (), and an Application Errors banner/section.
If there were any Spark failures during the app’s run, the number of failures appears in a red badge next to the Spark name in the tab.
For more information, see Code Analyzer for Apache Spark.
(YARN-only, MapReduce Apps) MapReduce Tab
For MapReduce applications this tab shows the number of mappers and reducers, and status information about them.
If there were any MapReduce failures during the app’s run, the number of failures appears in a red badge next to the MapReduce name in the tab.