Spark Details Report
The Spark Details Report contains TSD (time series data) charts and tables of correlating data for an application’s Spark execution stages. Separate charts show groups of related metrics; stacked rows of bar charts show stage details for each application job; and, when applicable, informational banners show application errors and skipped stages. To create an application’s Spark Details Report, you select App Search from the navigation bar, and search for the application or user of interest.
On This Page
Create an App’s Spark Details Report
You can create a Spark Details Report for any Apache® Spark application. If you do not know the ID or specific, fully-qualified name, you can search for the app by a combination of app name, user, queue, app type, and/or app status.
Procedure
-
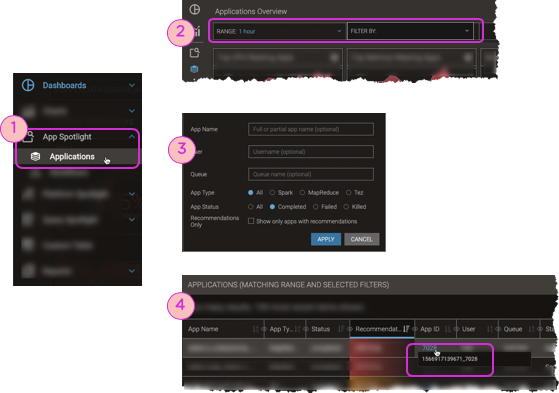
Navigate to the Applications Overview: using the left-nav, select App Spotlight > Applications.
-
In the filter bar, click Select Filter. The Apps filter opens.
-
Enter as many search fields as you want, and click Apply.
-
If you leave all the fields blank, the result is all apps that ran during the selected time range. They might have started before the time range, or ended after the time range, but if they were running at any point during the time range, they are included in the results.
(To change the time range, click Range in the filter bar, make your selection, and click Apply.)
-
Multiple search criteria are ANDed together.
-
Search fields are not case sensitive; searches for “alex”, “Alex”, and “aLEx” return the same results.
-
Entries are plaintext; do not use operators.
-
-
In the resulting table, click the App ID link to go directly to its App Details Page.
-
Select the Spark tab, and click .
The Spark Details Report appears for the application you chose.
Elements of the Spark Details Report
The Spark Details Report shows an app’s execution record and TSD info. You can correlate the visual and tabular data, view error reports and metrics, and view the Stage Executors Report of metrics charts for any stage:attempt.
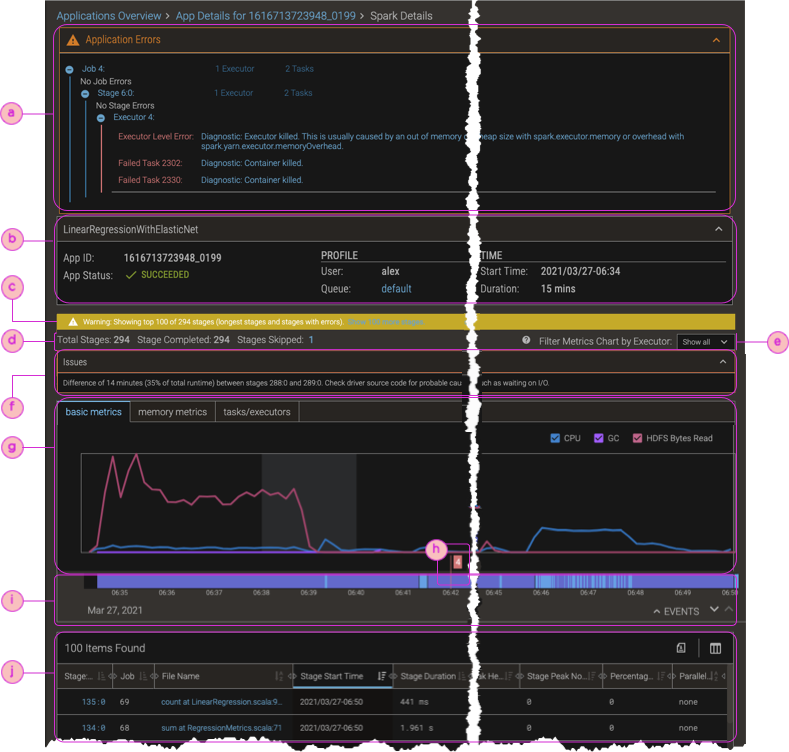
| ⓐ | Error section, expanded (not shown if no errors) This section tells you how many job, stage, executor, and task errors occurred. To show the detailed error report, click anywhere on the section's heading. Within a category (job, stage, executor, or task), the errors appear in the order that they occurred, from first to last. |
| ⓑ | The app info provides an summary of the application—its name, Id, type of app, and so on. |
| ⓒ | Chart alerts tell you about stages that are omitted from the display. By default, the charts show the 100 stages that most affected the app's performance or that had issues. You can click to show the remaining stages, at a cost to dashboard performance. |
| ⓓ | Stages status. The numbers of total and completed stages are always shown. If any stages were skipped, that is also shown. Skipped stages occur due to lazy execution: when Spark realizes that it does not need a stage's calculation, often because the stage's data is retrievable from cache, it skips the stage. In such cases, the report shows the stage in the Skipped Stages information, but not in the stage summary (ⓗ) or tabular stage data (ⓘ). |
| ⓔ | Executor show/hide filter. Select a single executor or all executors to show in the metrics charts; see Filter Data by Executor. (As of this document's writing, this feature is in-development for Kubernetes.) |
| ⓕ | Issues banner/section, expanded (not shown if no issues) This section highlights stage-specific errors as determined by Pepperdata's analysis of the stage data: excessive delay between the previous stage's completion time and the next stage's submission time; and excessive delay between the first stage's submission time and the app's start time. |
| ⓖ | Metrics chart groups (one group per tab)
The charts show only the data that is relevant to the environment (YARN or Kubernetes).
|
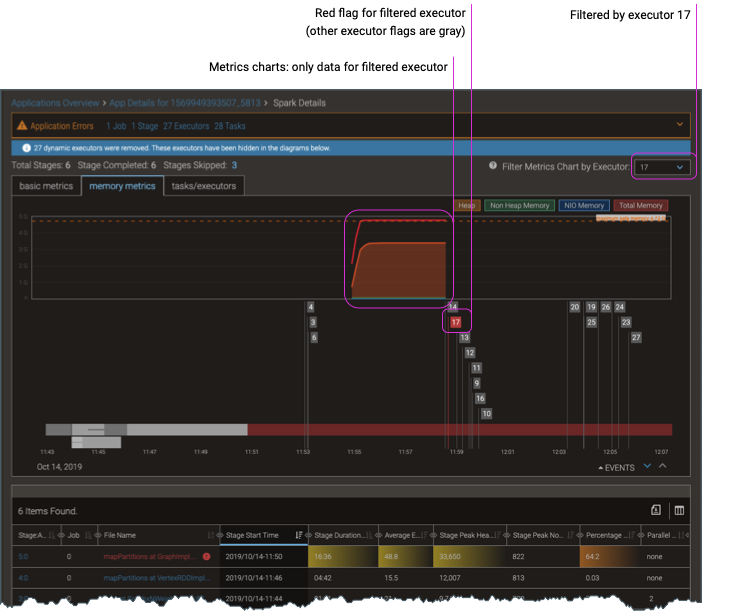
| ⓗ | Event flags for removed executors Flags mark executor events—when executors are removed—and indicate the reason:
To filter the charts to show only one removed executor, click the executor's event flag. In filtered charts, the selected executor appears in red, and all the unselected executors appear as dark gray (⚑). To toggle back to showing all executors, click the event flag of the currently-shown executor. The flags return to their original meaning: red for failed executors, and light gray for killed executors. |
| ⓘ | Stage summaries and events; click a stage’s block to see its Spark Stage Details Report. |
| ⓙ | Tabular stage data, with sortable columns; click a stage’s link (in the Stage:Attempt or File Name column—they reference the same stage) to see its Spark Stage Details Report. |
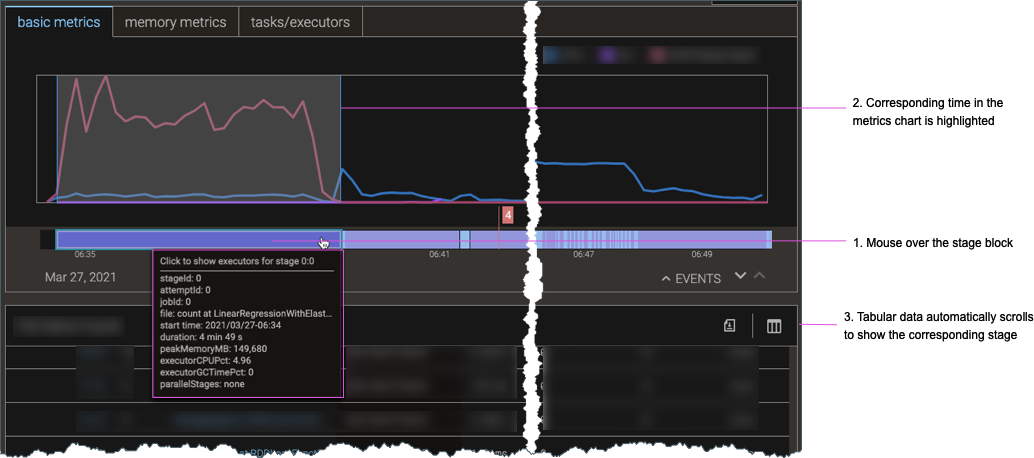
Highlight a Stage’s Data
The Spark Details Report interface makes it easy to find a given stage’s information in the metrics charts, stage summary, and tabular staging data. When you mouse over a block in the stage summary or mouse over a row in the tabular stage data, the corresponding time intervals and stage data are highlighted in the charts and brought to focus in the tabular data, or highlighted in the charts and stage summary, respectively.
That is, you can either:
-
Mouse over a stage block in the stage summary, as shown in the figure below. The corresponding time interval is highlighted in the metrics chart, and the corresponding stage is brought to focus in the tabular stage data.
-
Mouse over a row in the tabular stage data. The corresponding time interval is highlighted in the metrics chart, and the corresponding stage is highlighted in the stage summary.
Filter Data by Executor
The Executor Filter lets you filter the Spark Details Report by executor, enabling you to focus on just a single executor’s details in the metrics charts, stage summary, and tabular staging data. Alternatively, you can click an executor’s removed/filter flag to filter the displays. When filtered, the metrics charts show only the data for the given executor.
(As of this document’s writing, this feature is in-development for Kubernetes.)
In filtered charts, the selected executor appears in red, and all the unselected executors appear as dark gray (⚑). When you toggle back to showing all executors, the flags return to their original meaning: red for failed executors, and light gray for killed executors.