Query Spotlight User’s Guide
With Query Spotlight, IT operators can avoid missed SLAs due to inefficient and slow queries. Application developers and data analysts can avoid scheduling bottlenecks and inefficiently organized data that degrade performance. Query Spotlight provides visibility into database metrics (which lets you optimize performance), highlights which queries are poor performers, and provides operational context.
On This Page
Using Query Spotlight
Query Spotlight shows metadata that is inaccessible by other tools, and in the same dashboard as the rest of your cluster. When a query suddenly takes much longer to run than usual, it’s time for Query Spotlight:
-
Learn what other queries were running at the same time. Then look at why the slow query was scheduled to run when it was. If resource contention seems an issue, it’s time to tune the query scheduling.
-
Look at the Query Comparison page to see side-by-side data for any two queries that you select. Inspecting the queries’ performance metrics, their Pepperdata recommendations, and their configurations can help you determine what configuration updates to make to improve future runs of the query.
-
Look at resource usage (CPU, memory, storage). Bottlenecks indicate that the cluster is resource-starved. You can adjust resource allocation, redistribute the workload, or reschedule when resource-intensive queries should run.
-
Look at the explain plan (how your query optimizer turned the query into its separate operations and stages) and the query stage visualizer (stage execution timeline) to see which parts of the query are most in need of optimization.
Query Spotlight Overviews
Query Spotlight provides overviews for Queries and Databases.
Procedure
-
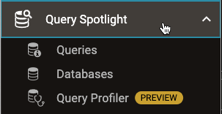
To show a Query Spotlight overview, use the “left-nav” menu, expand the Query Spotlight sub-menu, and click the overview you want.
The selected overview page appears. See the following:
Reference: Elements of an Overview Page
Overview pages share a common format for displaying information, and provide similar navigation controls.
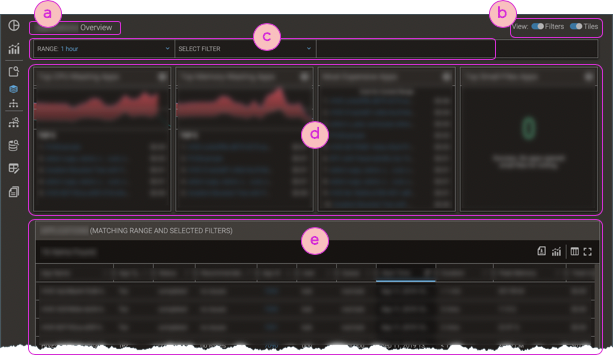
| ⓐ | Title of the overview page. The title matches the name of the currently selected left-nav's Spotlight menu item; for example, selecting Query Spotlight > Queries shows the Queries Overview. |
| ⓑ | Hide/show filter bars and, for pages with highlight tiles, hide/show highlight tiles. |
| ⓒ | Filter Bars; for details, see Filter Bars. |
| ⓓ | Highlight tiles (not in all overviews), filtered per the current filter bar settings. |
| ⓔ | Table of items that meet the applied filters' criteria; for details about table elements and filtering, see Tables. |