Comparing Queries
When a query runs poorly, receives many recommendations, or fails altogether, a useful troubleshooting technique is to compare it to a more successful run of the same query. The Comparing Queries page—a Query Spotlight feature that’s accessible from the table in the Queries Overview—shows side-by-side data for any two queries that you select. Inspecting the queries’ performance metrics, explain plans, their Pepperdata recommendations, and their configurations can help you determine what configuration updates to make to improve future runs of the query.
Create a Comparing Queries Page
The most direct comparisons are for two runs of the same query, which can help identify system/equipment issues. However, you can create a Comparing Queries page for any two queries. On the one hand, this can be very useful, such as for comparing resource usage after migrating an query from one query engine to another. But on the other hand, it can create misleading impressions, and be difficult to draw relevant inferences from; for example, the Pepperdata recommendations are in some ways very different for different query types.
Procedure
-
Navigate to the Queries Overview page: using the left-nav, select Query Spotlight > Queries.
-
In the Queries table (below the tiles), find the first query to compare, and select its associated comparison checkbox in the Compare Queries (compare_arrows) column.
The Compare Queries button text changes from
0 of 2to1 of 2. -
Find the second query to compare, and select its associated comparison checkbox in the Compare Queries (compare_arrows) column.
The Compare Queries button text changes from
1 of 2to2 of 2, and changes to blue to show that it’s enabled.Tip: If you lose track of which queries you’ve selected—perhaps because you’ve scrolled through many pages in the table—you can click the Compare Queries (compare_arrows) column heading to sort by selected/not selected queries. -
Click Compare Queries.
The Comparing Queries page appears. For details, see Elements of the Comparing Queries page.
Elements of the Comparing Queries Page
The figure shows a typical Comparing Queries page. Some sections appear only for certain types of queries, so your page might be slightly different.
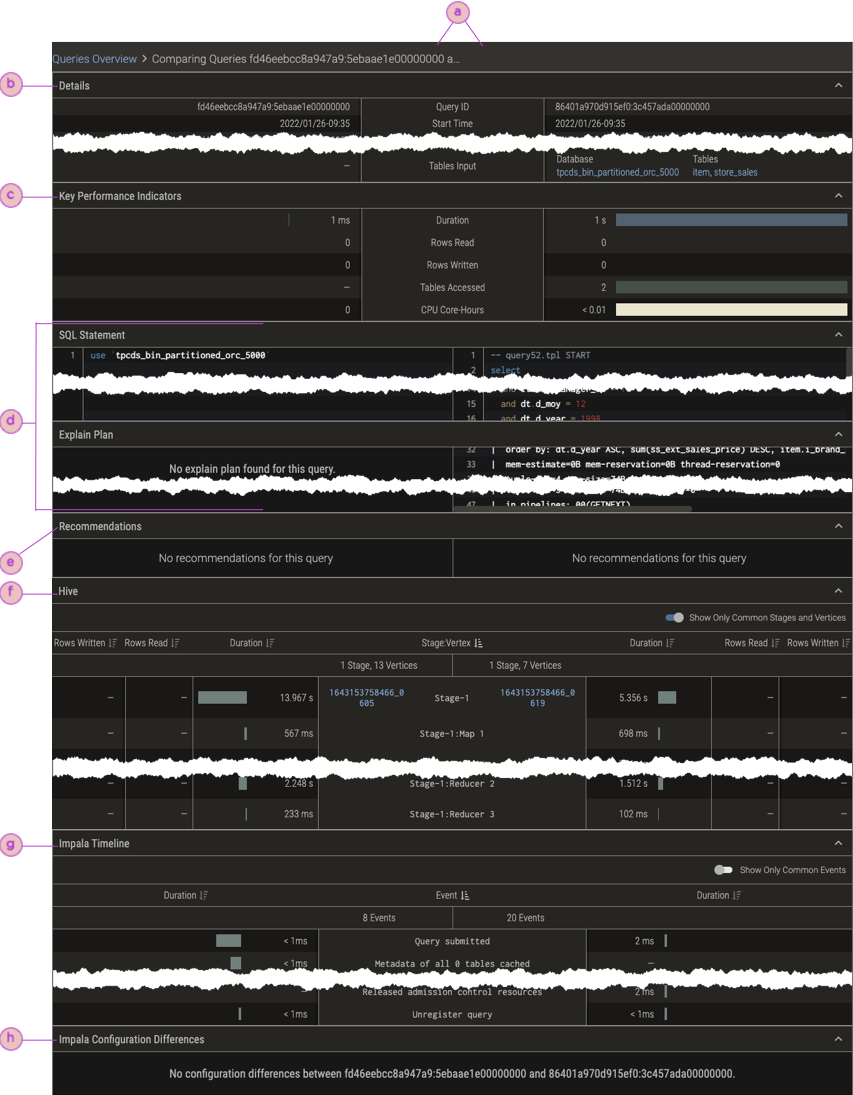
| ⓐ | Ids for the two queries being compared. |
| ⓑ | Details. Information about each query, such as its Query Id and name, start time, start latency, and status. Also, query-type-specific details, such as pool name for Impala queries. |
| ⓒ | Key Performance Indicators. Query-type-specific metrics. |
| ⓓ | Query Details: Statement and Explain Plan. Shows the queries statements and explain plans. |
| ⓔ | Recommendations. Comparison of the Pepperdata recommendations for the two queries. |
| ⓕ | (Hive queries) Hive. Stage and vertex information from the explain plan. |
| ⓖ | (Impala queries) Impala Timeline. Timeline data from the explain plan. |
| ⓗ | (Impala) Key Configuration Differences. Comparison of the actual configuration settings that were in effect for the two queries' runs. |