Query Profiler Report
The Pepperdata Query Profiler uses heuristics—rules and triggering/firing thresholds against which Pepperdata compares the actual metrics values for your queries—to generate recommendations. The Query Profiler report shows every instance of a triggered/fired heuristic; each instance is identified as an incident. Incidents are assigned a severity—critical, severe, moderate, or low—depending on the difference between your query’s metrics values and the heuristic’s firing threshold.
There is not a 1:1 correspondence between heuristics and recommendations. For example, a single heuristic might have a low and a high threshold, from which Pepperdata can provide distinct recommendations such as “Too long average mapper runtime” and “Too short average mapper runtime”.
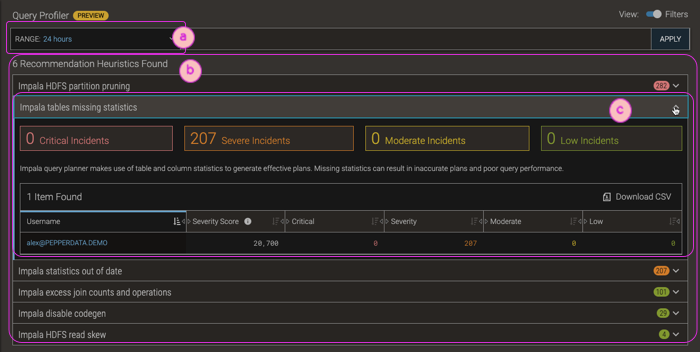
| ⓐ | Filter bar for customizing the time range. |
| ⓑ | Heuristics that were triggered/fired for your query. To expand/collapse the details of a heuristic, click anywhere in its row. |
| ⓒ | An expanded heuristic.
|