Query Details Page
The Query Details page provides an at-a-glance view of any issues that a query experienced during its run, as well as status information that likely contributed to the query’s success or problems.
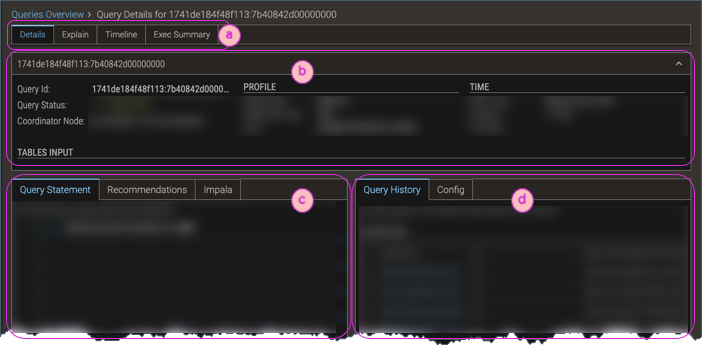
| ⓐ | Top-level tabs provide access to sub-pages of query details.
|
| ⓑ | The Header provides an overview of the query—its name, Id, start latency, status, query type, statement type, and so on. |
| ⓒ | The tabs in the Primary section—where you should begin your exploration of the query—show the query statement, recommendations (see Recommendations in Query Spotlight), and query-type-specific runtime metrics. |
| ⓓ | The Stats section shows the query history and any other information that is available for the query type:
|