Memory Swapping Detection and Mitigation in the Pepperdata Supervisor (Parcel)
Swapping is a memory management technique that computer operating systems (OSes) use to ensure that RAM is maximally used on processes that need it. During swapping, the OS moves processes between virtual memory on disk and physical RAM. Swapping is a normal, expected part of operation, but it can be a problem when there are too many processes scheduled to run at once.
When the OS spends too much time loading and unloading pages from disk onto memory—referred to as thrashing—the computer’s performance degrades, at best, and at worst the computer can become inoperable. In a distributed computing environment such as Hadoop, if even just a single machine slows down due to excessive swapping, it can negatively affect jobs across the entire cluster. Therefore, it’s imperative that cluster operators be able to quickly identify hosts that are excessively swapping, and take mitigating actions such as killing jobs to reduce both swapping and overall load on the host.
Automatic Swap Detection and Response
The Pepperdata Supervisor employs a machine learning (ML) algorithm that continuously monitors metrics such as pages of memory being swapped in and out of physical RAM, and detects when there is excessive swapping on any host in the cluster.
The Swap State metric (metric code-name, n_sdss) keeps track of the level of swapping on each host.
In This Section
- Swap State Metric Values
- Interpret the Charts: Automatic Swap Detection and Response
- Disable Automatic Swap Detection and Response
Swap State Metric Values
The table describes the values the Swap State metric can take.
| Swap State | Host’s Swapping Conditions | Pepperdata Supervisor Response |
|---|---|---|
| 0 | Normal | No action needed. |
| 1 | Warning: The number of pages being swapped has crossed a threshold that can trip the host to extreme swapping if more jobs are added. | If Pepperdata Capacity Optimizer is enabled on the host, Capacity Optimizer stops adding capacity so that the Hadoop scheduler does not add jobs on the host. |
| 2 | Extreme: The number of pages being swapped has crossed a critical threshold, and load must be reduced to avoid thrashing. | To relieve pressure on the host, Pepperdata Supervisor selectively kills tasks on the host. Newly launched YARN containers are killed first, which means that MapReduce is targeted before long-running YARN containers such as Apache Spark and Apache Tez. Application Masters and HBase daemons are never killed. |
Interpret the Charts: Automatic Swap Detection and Response
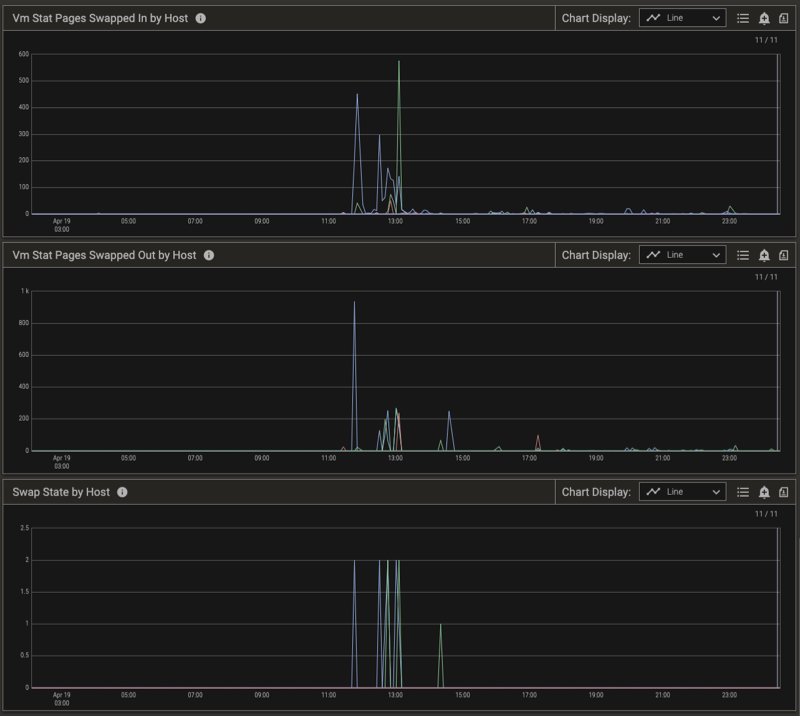
To further explain how Pepperdata performs automatic detection and response, let’s examine a single host on a medium-size production cluster (~100 hosts) running thousands of tasks. Pepperdata Supervisor monitors the Swap State of each host in the cluster, evaluating the number of pages swapped in and out (see the Vm Stat Pages Swapped in by Host and Vm Stat Pages Swapped Out by Host charts, below), and takes action on a per-host basis in near real time to prevent thrashing.
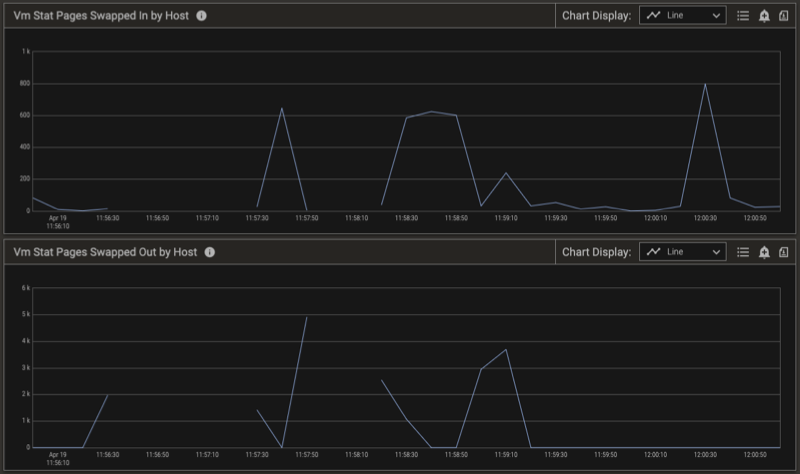
The Swap State changes from 0 (Normal) to 2 (Extreme) when the relative number of pages swapped out and in indicates extreme swapping on this host. To prevent thrashing on the host, Pepperdata Supervisor steps in, and in conjunction with YARN starts killing tasks to return the swapping to a normal level. This is shown in the charts by the Swap State returning to 0. You can confirm the results by observing the free memory available on the host. (See the Swap State by Host chart, below.)
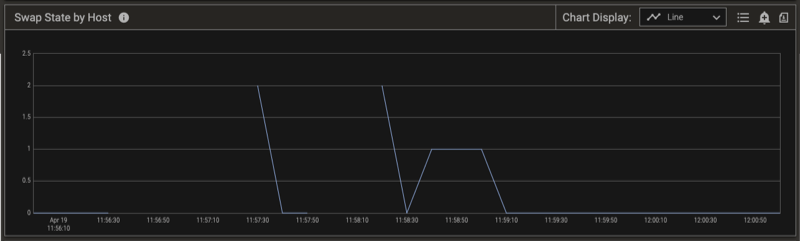
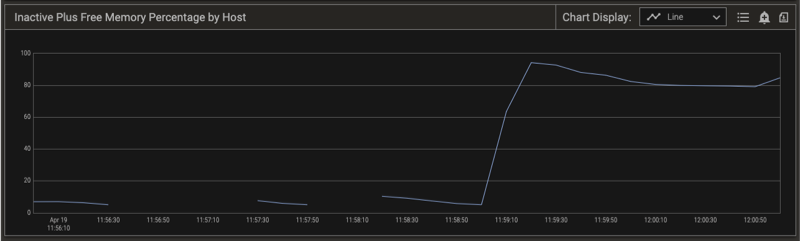
Notice the time stamps for the Swap State by Host chart (above) and the total Inactive Plus Free Memory Percent by Host chart (below). When the Swap State indicates extreme swapping, the free memory on the host drops to zero (0). As the Pepperdata Supervisor kills tasks to reduce the pressure on the host, the available memory increases and the Swap State on the host returns to zero (0), indicating the return to the desired Normal condition. Note that the only tasks that Pepperdata Supervisor kills are Mappers, Reducers, and YARN containers.
Disable Automatic Swap Detection and Response
Procedure
-
Use Cloudera Manager to add the following snippet to the Pepperdata > Service Wide > Pepperdata Service Advanced Configuration Snippet (Safety Valve) for conf/pepperdata-site.xml template, as an XML block.
<property> <name>pepperdata.supervisor.allocation.swap.response.enabled</name> <value>false</value> </property> -
Refresh the YARN ResourceManager configuration to reload the properties:
-
(YARN 2) Load the new configuration: in Cloudera Manager, select the Refresh action for the ResourceManager.
-
(For YARN 3, you do not need to manually load the new configuration because the PepAgent automatically forwards it to the capacity monitor.)
-
To re-enable the controls, remove the property or change its value to true, and again refresh the YARN ResourceManager configuration.
Verifying Swap Detection Behavior
You can verify that swap detection and response are working as expected by viewing the applicable charts.
Procedure
-
In the left-nav menu, select Charts.
-
In the filter bar, click Metrics.
-
In the search box, clear any previously selected metrics, and enter the search term, “swap” (without the quotation marks), and select the following metrics from the Host > Memory > Memory information group:
swap statevm stat pages swapped invm stat pages swapped out
-
In the search box, replace the “swap” string with “inactive”, and select either or both of the following metrics from the Host > Memory > Memory information group:
inactive plus free memoryinactive plus free memory percentage
-
Click Apply.
-
(Optional) From the filter bar, change the time range, select breakdowns and filters, and/or change advanced options, and click Apply.
If you did not change the series breakdowns from the default Summary value, the Pepperdata dashboard shows summaries for the resulting charts. To focus on the specific hosts that experienced excessive swapping in the time range that you selected, use the Legend to filter the results.
The charts below show a cluster that experienced some swapping, as well as the corresponding metrics.