Broker Details Page
The Broker Details page surfaces everything that is known about a given broker.
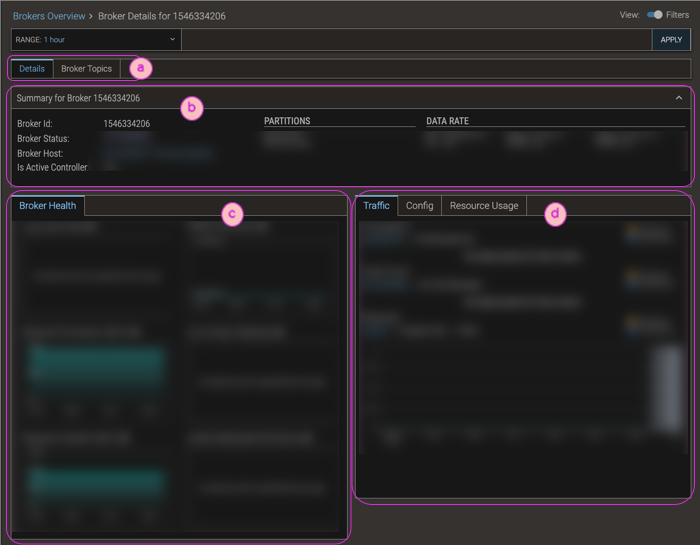
| ⓐ |
Top-level tabs provide access to sub-pages of broker details.
- The Details tab (which is what is described in this documentation page) is the default for the Broker Details display.
- The Broker Topics tab shows a table of all the topics associated with the given broker, with metrics data for each topic. To navigate to a topic's Topic Details page, click the topic ID's hyperlink.
|
| ⓑ |
The Header provides an overview of the broker—its Id, status, host (which is a hyperlink to the Hosts Overview page, filtered by this host), partitions, and data rate. |
| ⓒ |
The Broker Health tab shows metrics mini-charts for an at-a-glance view of flush rate, processor and handler idle times, partitions, and replicas. |
| ⓓ |
The Stats section shows additional data that is available for the broker:
- Traffic—Throughput data, and metrics charts that visually highlight the traffic levels for producers and consumers for the broker.
- Config—The actual configuration settings that were in effect for the broker. If there were performance or resource issues with the broker, it's helpful to see its configuration, and then make subsequent changes for the future. Values are collected at 6-hour intervals for configuration keys, with per-broker override capability.
- Resource Usage—Charts that highlight the most important metrics: Basic Metrics (CPU and memory usage) and I/O Read/Write Bytes.
|